Flexible subnetworks reveal the quasi-cyclic nature of integration and segregation in the human brain
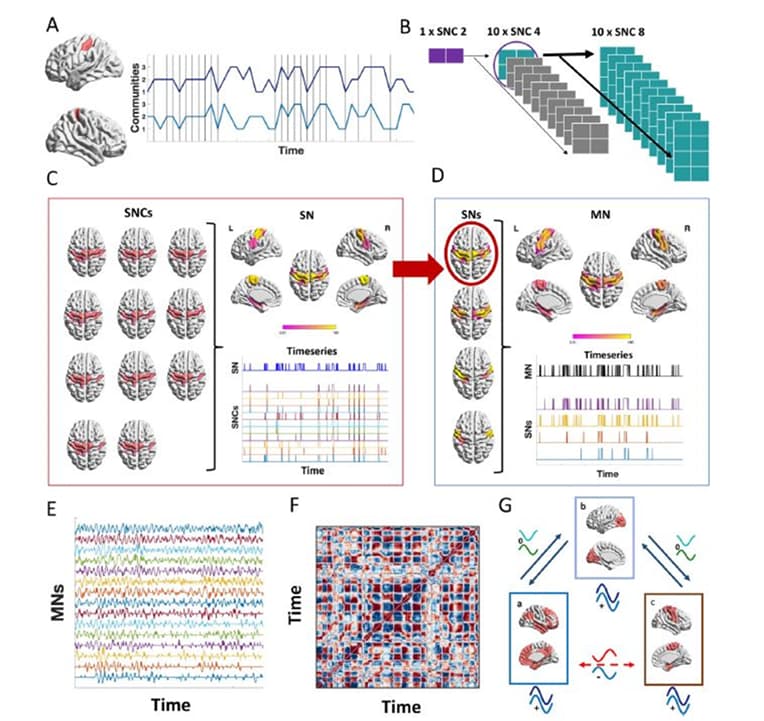
Figure Legend: Schematic figure that summarizes the key steps for the proposed model. A) The calculation of the parameter q int is illustrated for the case of a pair of brain areas in the left and right motor cortex. Vertical lines denote the time points when the areas are assigned to the same community. The parameter q int for the two areas is then computed as the number of times they are assigned to the same community divided by the total number of time points in the fMRI time series. B) Based on the highest values of q int , seeds pairs are selected for each area and expanded in an iterative search to identify SNCs (subnetwork components) with an increasingly larger size. At each iteration (i.e. increase in size of SNCs) the ten constellations of brain areas with the highest q int are selected and included as seeds in the next iteration. The search is halted when the SNCs reaches a size of eight areas. C) An example of how 11 SNCs together form a SN (subnetwork) located in the motor cortex. D) An example of how SNs are clustered together to represent a MN (meta-network). E) Schematic representation of state vectors (the amplitude values of the MNs) that are the combined representation of time resolved amplitude fluctuations in all MNs (the same type of vector can be constructed from SNs). F) Recurrence plot representing the correlation between all state vectors. G) Schematic illustration of integration (positive phase coherence) and segregation (orthogonal or negative phase coherence) between SNs in different communities. While the SNs in each community a, b and c are integrated (internal positive phase coherence) they are segregated vis-à-vis each other. SNs in a and c are the most segregated by virtue of their negative phase coherence. In order for these networks to integrate they would have to make a transition through intermediary states of orthogonal segregation (b) illustrated by dark blue double lines. The red dotted line between a and c signify that SNs cannot make a direct transition between them.
Publication: Strindberg M, Fransson P, Cabral J, Åden U. Spatiotemporal flexible subnetworks reveal the quasi-cyclic nature of integration and segregation in the human brain. NeuroImage, https://doi.org/10.1016/j.neuroimage.2021.118287 (2021).