Feature level sets for multi-field visualization
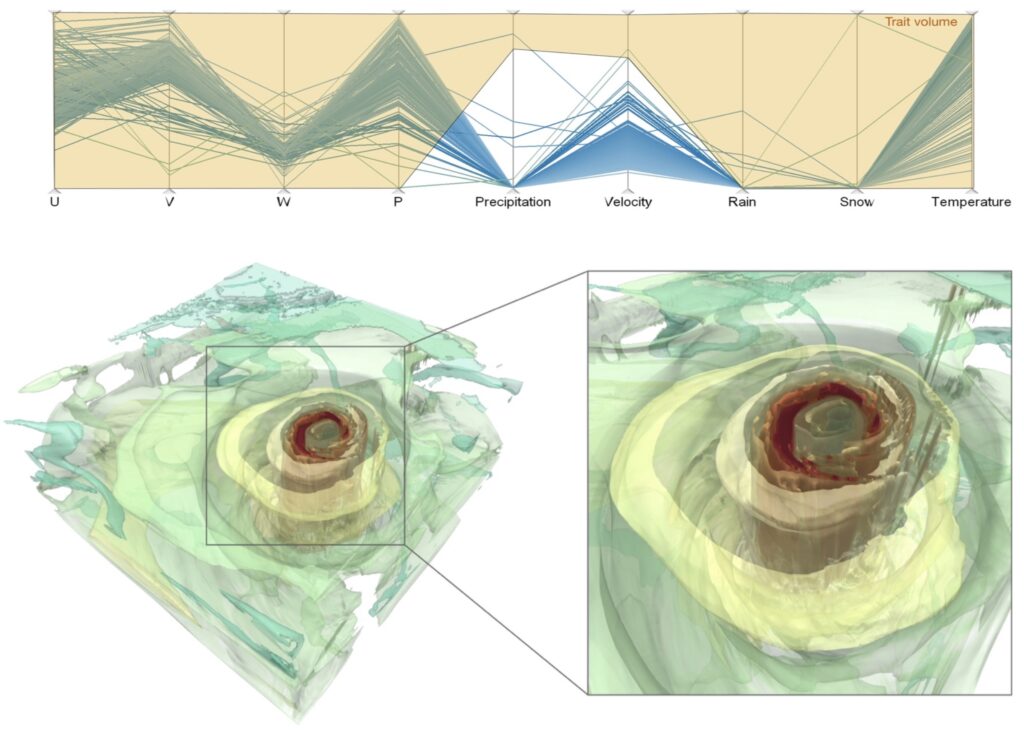
Figure: Visualization of the simulation of the Hurricane Isabel. Top: Traits of interest can be specified using parallel coordinates here represented by the yellow polygon. In this example it is defined by high wind speed and high precipitation. Bottom: rendering of the resulting feature level sets. The color of the surfaces represents the severity of the weather conditions with respect to the trait definition. The red surface highlights the area that comes closed to this trait. Observe that the weather conditions are less severe in the eye of the hurricane shown by a yellow feature level-set.
Iso-surfaces or level-sets provide an effective and frequently used means for feature visualization. However, they are restricted to simple features for uni-variate data. The approach does not scale when moving to multi-variate data or when considering more complex feature definitions. In this work, we introduce the concept of traits and feature level-sets, which can be understood as a generalization of level-sets as it includes iso-surfaces, and fiber surfaces as special cases. The concept is applicable to a large class of traits defined as subsets in attribute space, which can be arbitrary combinations of points, lines, surfaces and volumes. The concept is implemented into a system that provides an interface to easily define traits in an interactive way and multiple rendering options. We demonstrate the effectiveness of the approach using multi-variate data sets of different nature, including vector and tensor data, from different application domains.
Reference: Feature Level-Sets: Generalizing Iso-surfaces to Multi-variate~Data. J. Jankowai and I. Hotz. IEEE Transaction on Visualization and Computer Graphics, 2018.