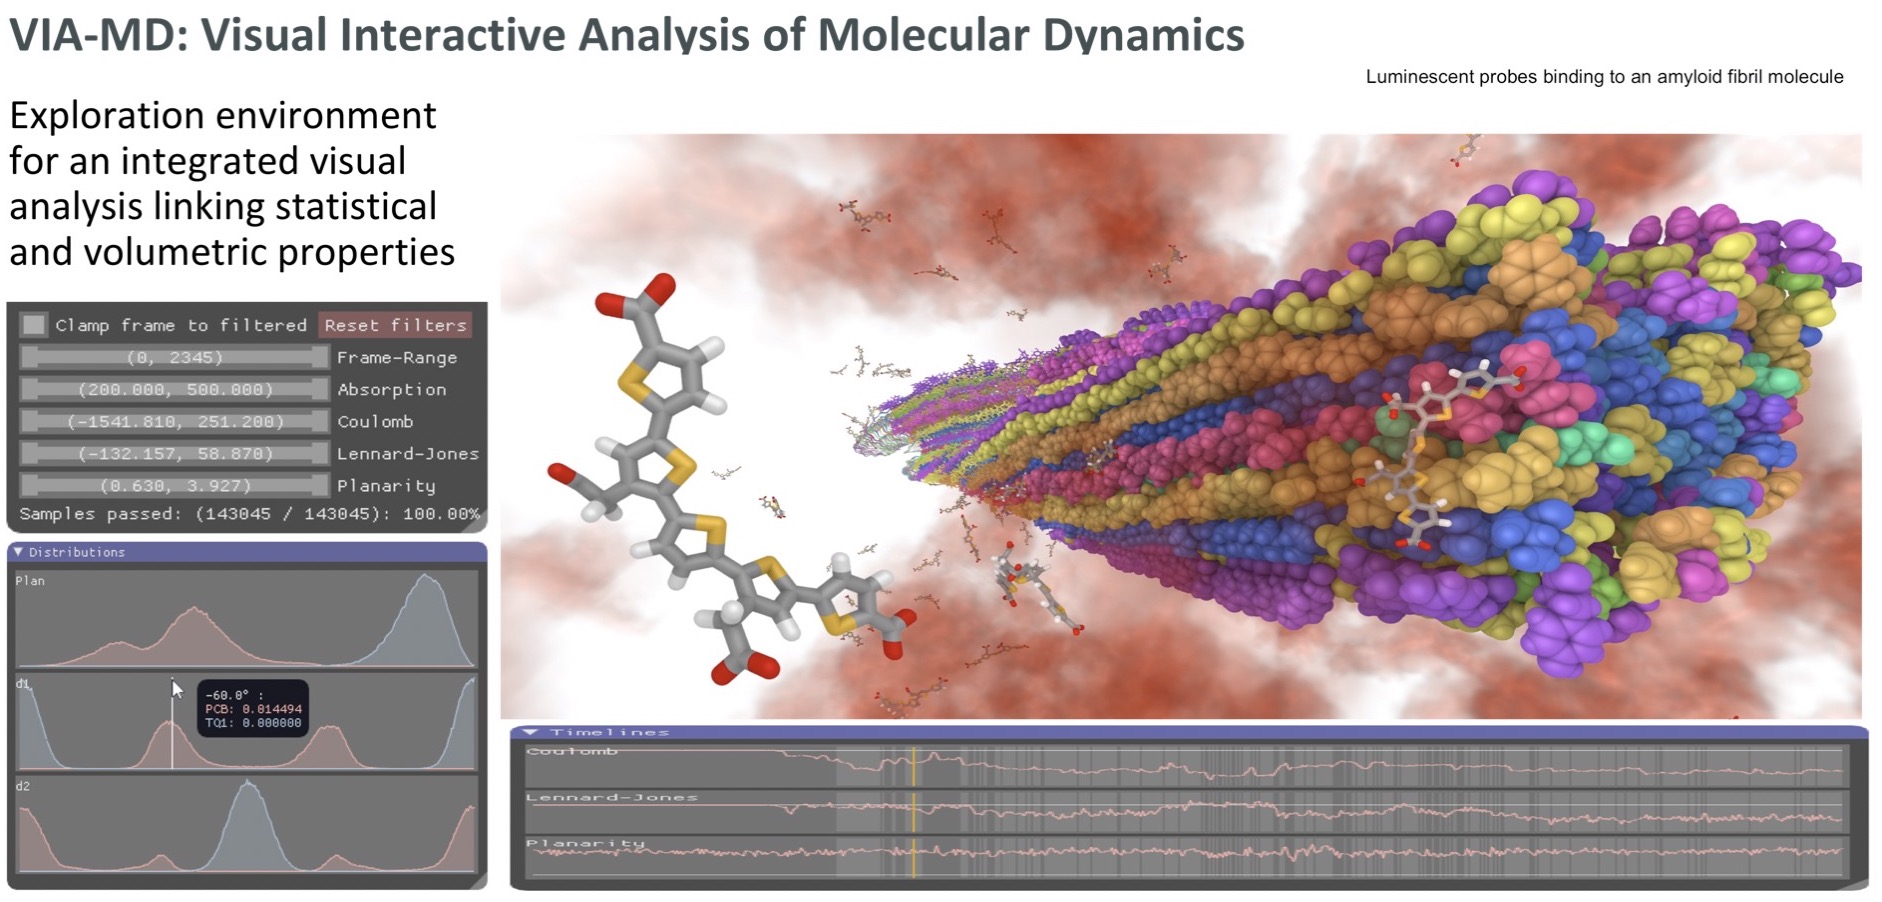
A visual analytics environment VIA-MD(visual interactive analysis of molecular dynamics) tailored for large-scale spatio-temporal molecular dynamics simulation data has been developed. A key concept of the environment is to link interactive 3D exploration of geometry and statistical analysis. Semantic property editor support the specification of complex molecular properties for filtering and aggregation. Thus it is possible to interactively and effectively find spatial, temporal and statistical patterns hidden in large data volumes [1]. One example is the identification of binding sites for the interaction between a pentameric oligothiophene and an amyloid-b(1–42) fibril from molecular dynamics simulations [2]. In this site, the probe is locked in an all-trans conformation due to the interactions between the anionic carboxyl groups of the probe and the cationic e-amino groups in the lysine side chain. The identification of interaction “hotspots” has been achieved with the use ofcombined filter parameters connected with probe molecular planarity and probe–fibril interaction energetics provided by VIA-MD.
References:
[1] Binding sites for luminescent amyloid biomarkers from non-biased molecular dynamics simulations.C. König, R. Skanberg, I. Hotz, A. Ynnerman, P. Norman and Mathieu Linares.Chem Comm, 2018